Assemblies
What is an assembly?
GSA uses finite element modelling, an approximation method that subdivides a complex structure into smaller, simpler elements, whose behaviours can be analysed individually.
Engineers thinking in terms of large entities or structural elements, such as cores, slabs, or trusses, may wish to integrate their results from the finite elements to understand how the structure will behave as a whole.
Assemblies are also a useful way of collecting data from large structures made up of many different elements.
You can read more on the theory behind assemblies in our more detailed theory guide to assemblies.
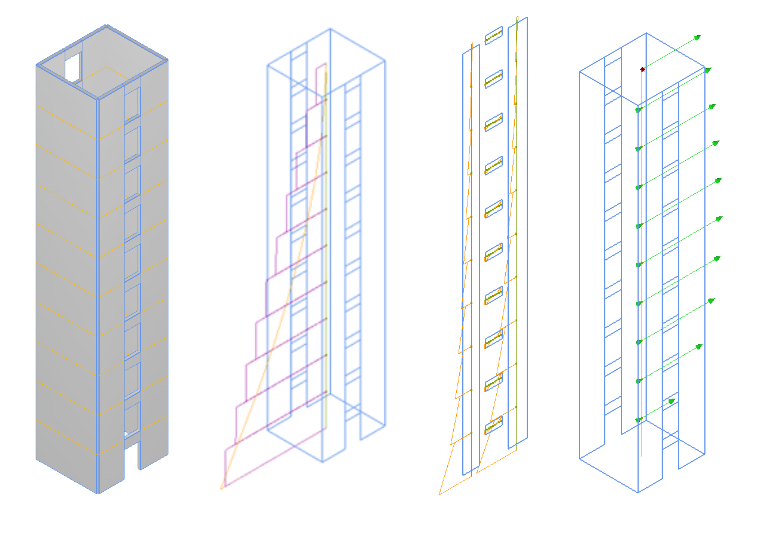
Example: A model of a building with a reinforced concrete core may contain 1000s of elements to give an appropriate model resolution. An assembly brings together the results of any group of elements, so that the total overall effects on the core, or any part of that core, can be calculated and visualised: including forces, displacements, drifts and drift indices.
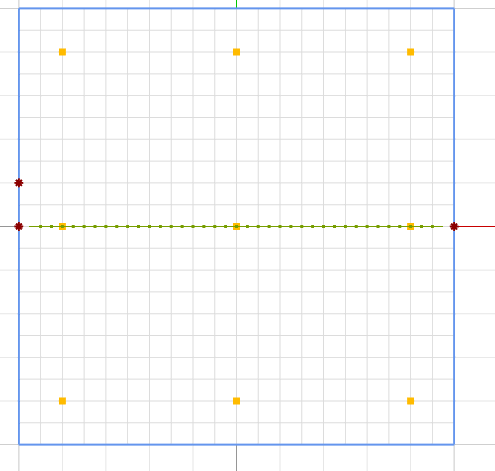
Assemblies are defined by the members or elements they contain. Extents in the y and z directions can be constrained. Extents define a prism and only the parts of elements inside that prism are considered as part of the assembly.
Tip: Our how-to guide to assemblies features more on extents, how they are used in creating assemblies, and how to define assemblies.
Working with assemblies
Display
Assemblies are represented in the Graphic view by a green line along the assembly centreline, with a dot at each point at which results are calculated.
To hide these, go to the Properties panel > Graphics tab > Hide > Entities > Assemblies.

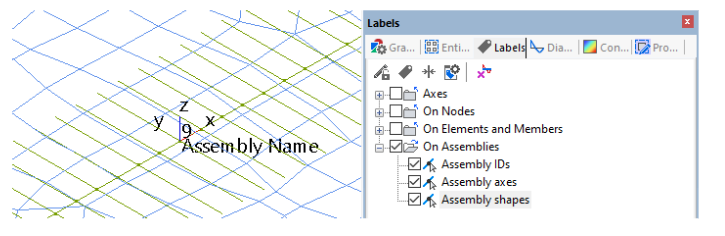
Additionally, Assembly IDs, axes and shapes can be displayed by ticking the corresponding boxes under the Labels tab. The shape is defined by the y and z extents provided in the definition. If these are both zero, then no shape is shown.
Tip: Shortcut buttons for these can be added by clicking the dropdown arrow in the Labels toolbar, typically found above the graphic window.
Results
Like beams, assemblies may be considered where the intermediate points are specified as part of the assembly. Results are calculated at these points only, and, as with beams, forces and displacements are available for six degrees of freedom.
Results are also calculated about the defined centreline. Therefore, the location of the centreline can affect the results displayed. For example, any offset of from the centreline will lead to additional moments.
Results can be outputted, plotted on diagrams, or contoured like beam results.
When an assembly is defined by storeys, two further options are available to view: Storey drift and Drift index. Storey results are also calculated just above and below the storey, so that the typically stepped nature of some of these results is captured in the output.
Assembly results are calculated on demand. Unlike node and element results, assemblies can be defined and modified post-analysis. This does mean that it can take longer to display assembly results, particularly if the assembly contains many elements or members.
When looking at assembly results from a response spectrum analysis these results are calculated for the assembly for each mode and then the results combined according to the selected combination rule across the modes.
Use the diagrams toolbar to view integrated results for multiple elements.