# Navigating UI
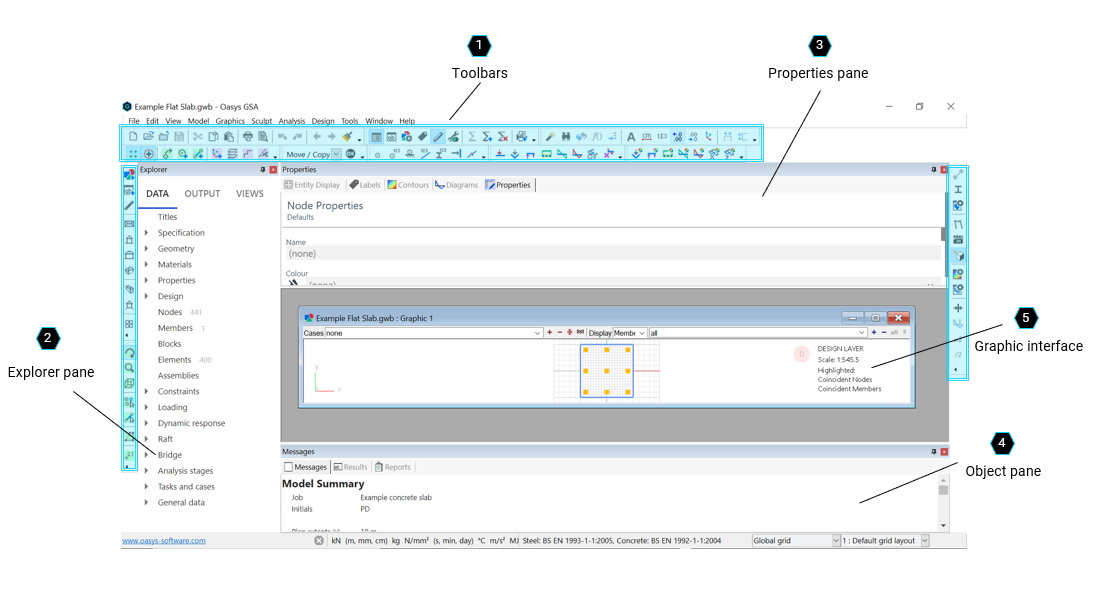
# 1. Toolbars
GSA's toolbars are a shortcut to frequently used commands. They are arranged initially along the top and sides of the interface, but are also dockable. Toggle toolbars on/off by going to:
View > Toolbars and dockable panes
Tip: Use the dropdown arrow at the end of each toolbar to add or remove buttons for additional commands.
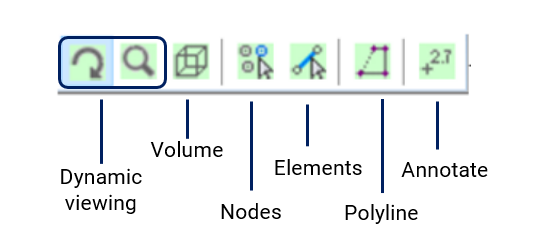
# GSA toolbar
Provides access to some of the main GSA tools, including view panes, design and analysis options.

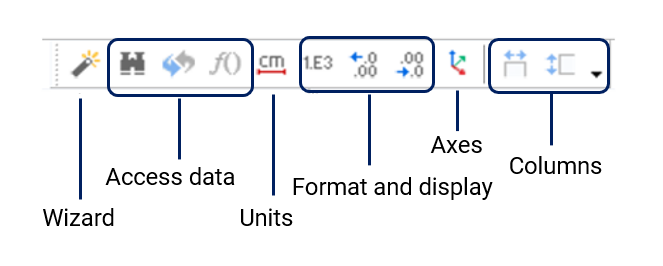
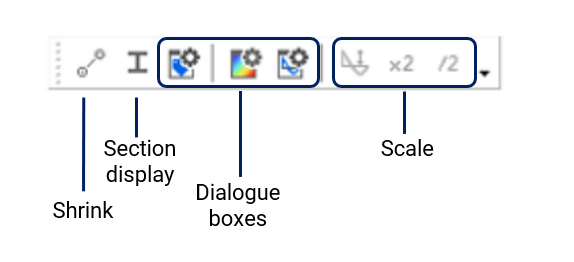
# Data options
Modify your model's data, and how it is displayed here.
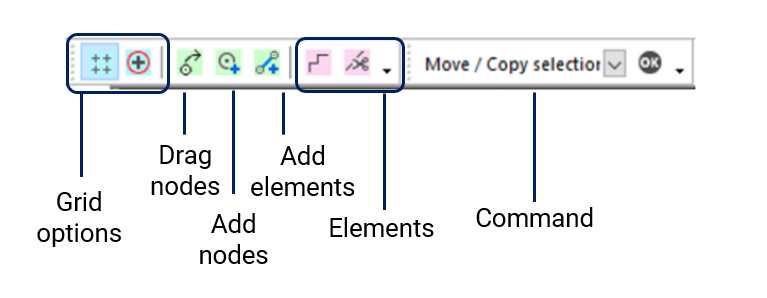
# Sculpt
Sculpt (opens new window) tools allow you to edit your model in the graphic view.
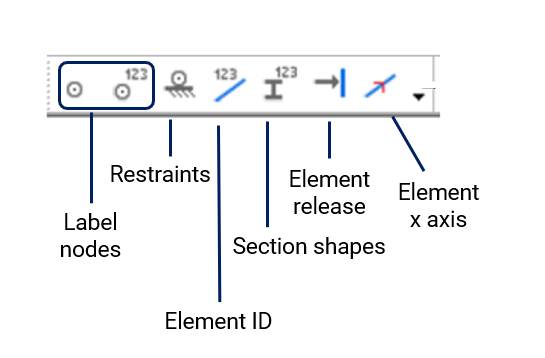
# Labels
Display model attributes by applying labels (opens new window) to you model.
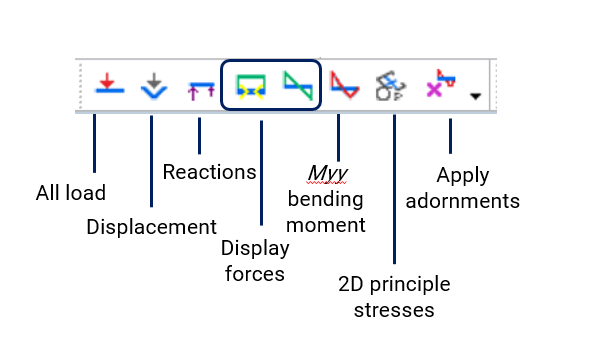
# Diagrams
Access frequently-used diagram (opens new window) displays.
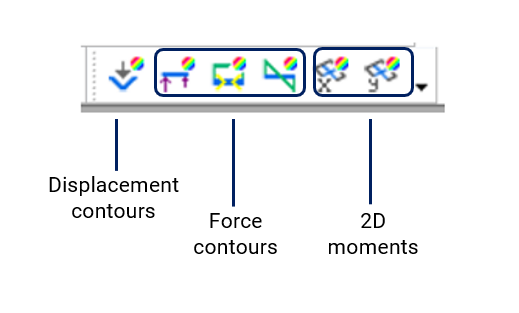
# Contours
Apply contours (opens new window) to nodes and elements from here.
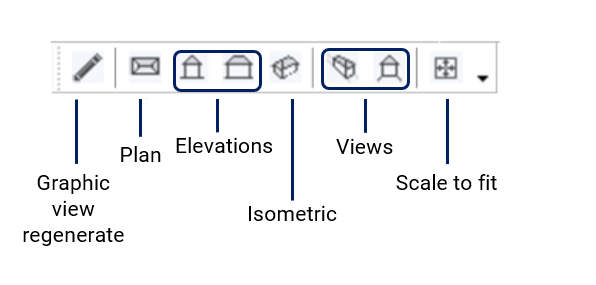
# Orientation
Change your display orientation (opens new window) here.
# Cursor mode
Change your cursor modes (opens new window).
# Graphic display
Access tools to modify the appearance of your display (opens new window) here.
Visit the GSA References entry on toolbars (opens new window) for more on this topic.
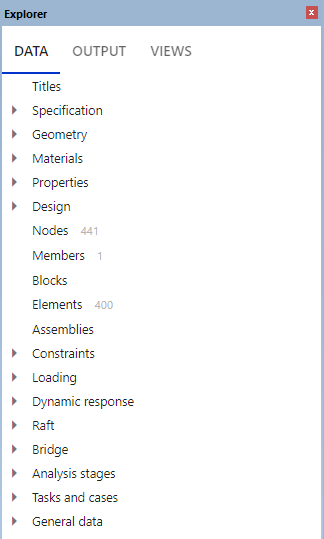
# 2. Explorer pane
The Explorer pane is where your model's data is contained. It is split into three tabs: Data, Output and View.
Note: Both the Explorer and Properties panes are dockable, they can be maximised, minimised and moved freely around the interface.
Within each tab you can:
- Right click on a field to delete, copy, and paste.
- Use Ctrl + select to open multiple data items.
The Data tab displays a list of input fields available in GSA. Click on a field to open its corresponding Data input table.
The Output tab displays a list of available data output options, depending on the state of the model.
The View tab presents a list of graphic and output views. You can also save preferred settings for views, which are available to access here.
- A graphic view displays a graphic image of the structure (i.e., on the central graphic interface).
- Output view displays tabular output.
Tip: Tabular views may be useful for editing data with very large records (e.g., nodes), or for presenting corresponding modules alongside one another, (e.g., beam sections and beam loads).
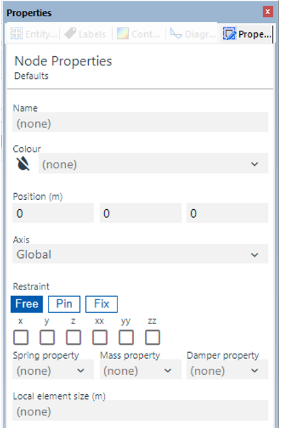
# 3. Properties Pane
From the Properties pane, you can edit the data inputted into your model.
Note: All tabs in properties pane offer the Lock image update command. This feature is useful for large models which take a considerable time to update the view. Rotating, zooming, or panning the view will unset Lock image update.
# Properties
Configured according to the current definition entity. To set this,
- Click on an entity in the graphic view.
- Go to Explorer pane > Views > Graphic views, where it will be highlighted.
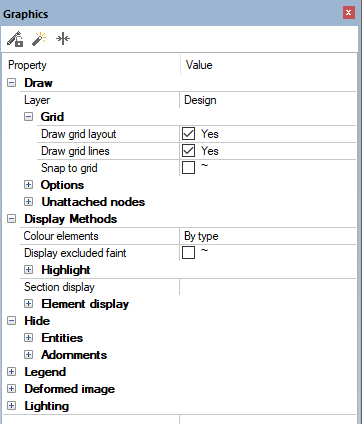
# Graphics
Displays a list of frequently used graphic view settings. Icons in the graphics pallet include:
- Wizard – adjust graphic settings here.
- Reset display adornments – re-sets graphic settings to current defaults.
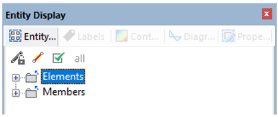
# Entity display
Presents the entities displayed in the current graphic view.
- Highlight mode - highlights selected entities in the graphic view.
- Check boxes - view list of entities with check boxes, to allow multiple selection.
- Reset to all entities - resets display list to ‘all’, and clears ‘volumes’.
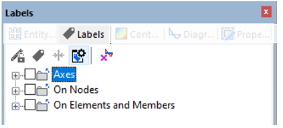
# Labels
Adjust label display in the graphic view.
- Hide labels - toggles on/off, without adjusting labelling settings.
- Reset - default settings.
- Labels and display methods - opens label and display methods dialog box.
- Apply adornments to selection - applies to current selection only.
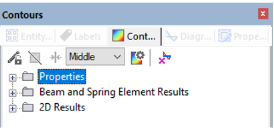
# Contours
Set contours in the graphic view.
- Hide contours - toggles on/off.
- Reset - default settings.
- Layer combo - sets output layer for 2D element stress contours.
- Contour settings - opens contour settings dialog.
- Apply adornments to selection - applies to current selection only.
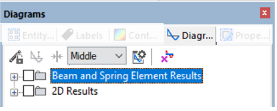
# Diagrams
Set diagrams in the graphic view.
- Hide diagrams - toggles on/off.
- Reset - default settings.
- Layer combo - sets output layer.
- Diagram settings - opens contour settings dialog.
- Apply adornments to selection - applies to current selection only.
# 4. Object pane
The Object pane consists of messages, results and reports.
Messages
- Displays properties for a selected item.
Results
- Displays specific results for a selected node or element.
Reports
- Presents an output log from processes such as a data check or analysis.
# 5. Graphic interface
The central graphic interface (or graphic view) is where your model's structures are displayed. Any number of graphic views may be opened for a document.
# Views in the graphic interface
# Moving windows
Note: You can also move windows using the keyboard shortcut Ctrl + Nos. 1-9 on the number pad.
# View settings
Use the paintbrush icon  in the top toolbar to copy view settings to another graphic view: