Navigating UI
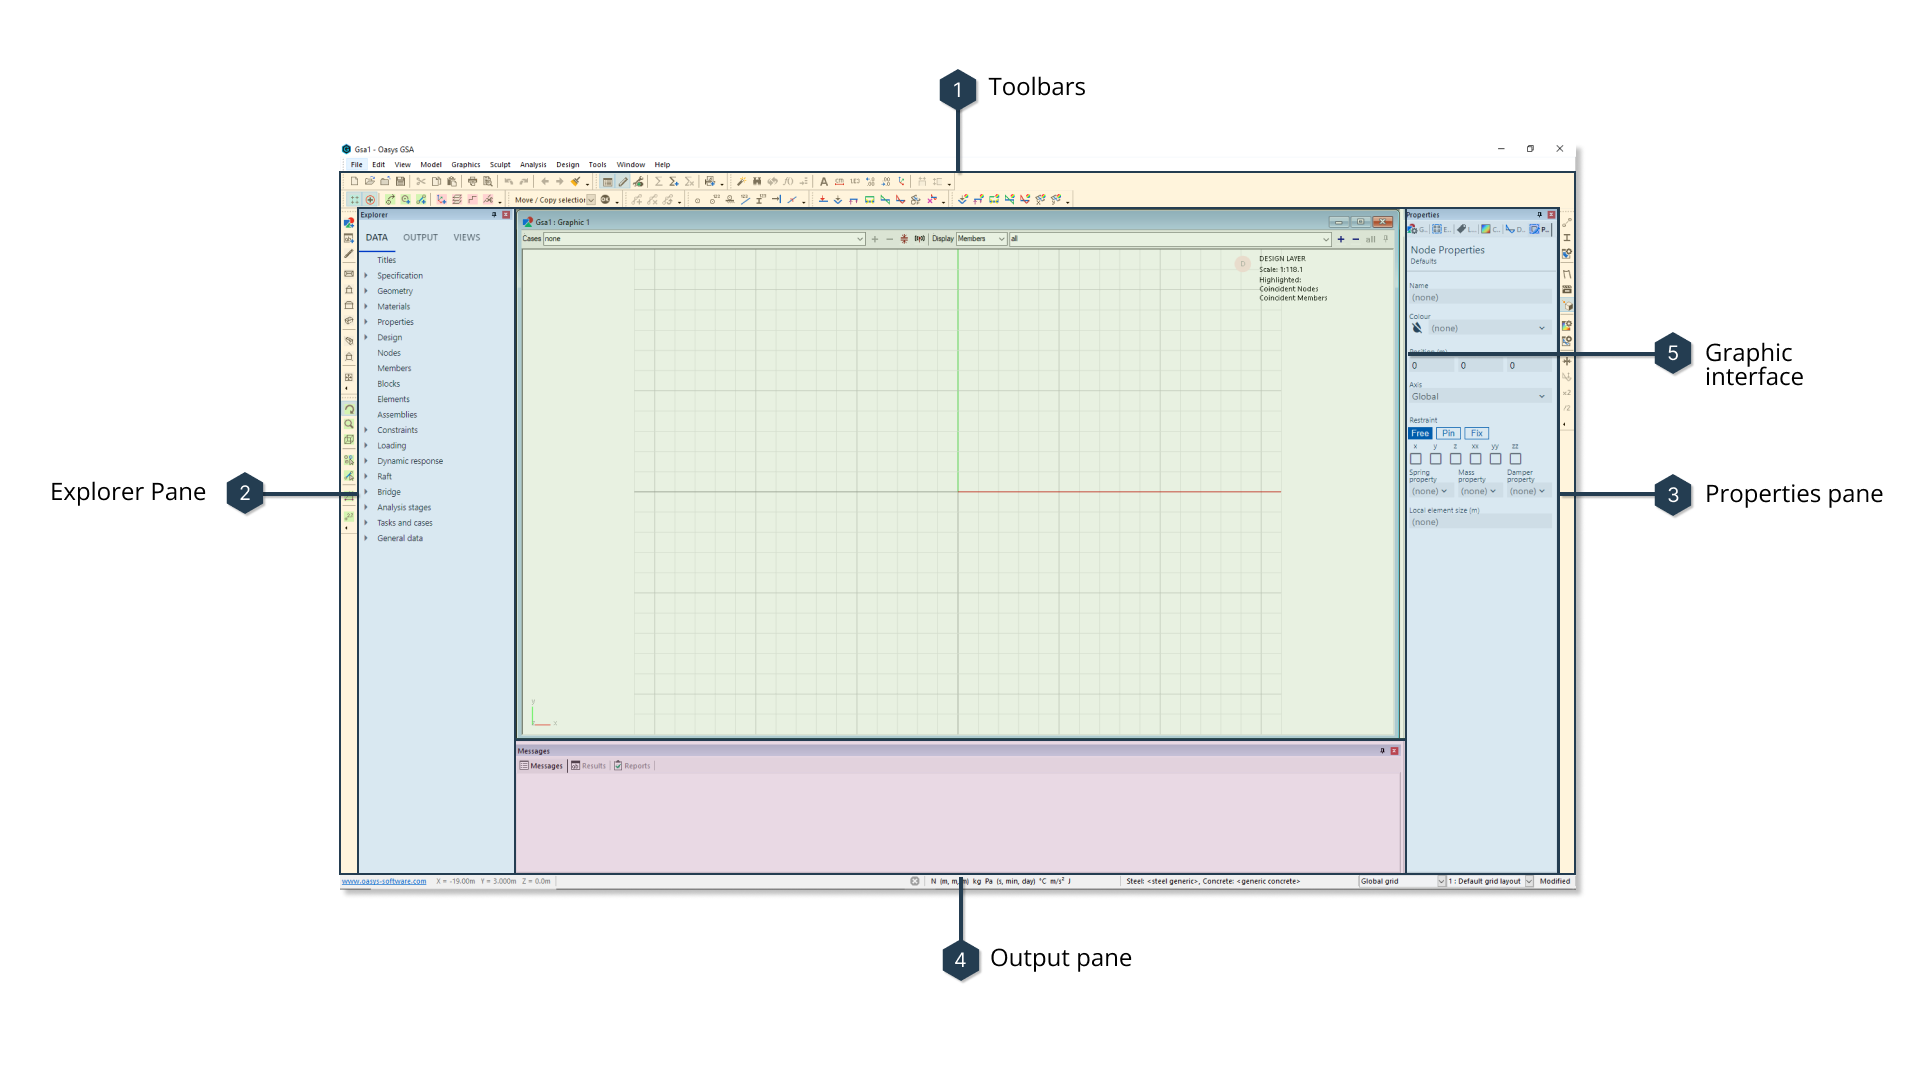
1. Toolbars
GSA's toolbars are a shortcut to frequently used commands. They are arranged initially along the top and sides of the interface, but are also dockable. Toggle toolbars on/off by going to:
View > Toolbars and dockable panes
Tip: Use the dropdown arrow at the end of each toolbar to add or remove buttons for additional commands.
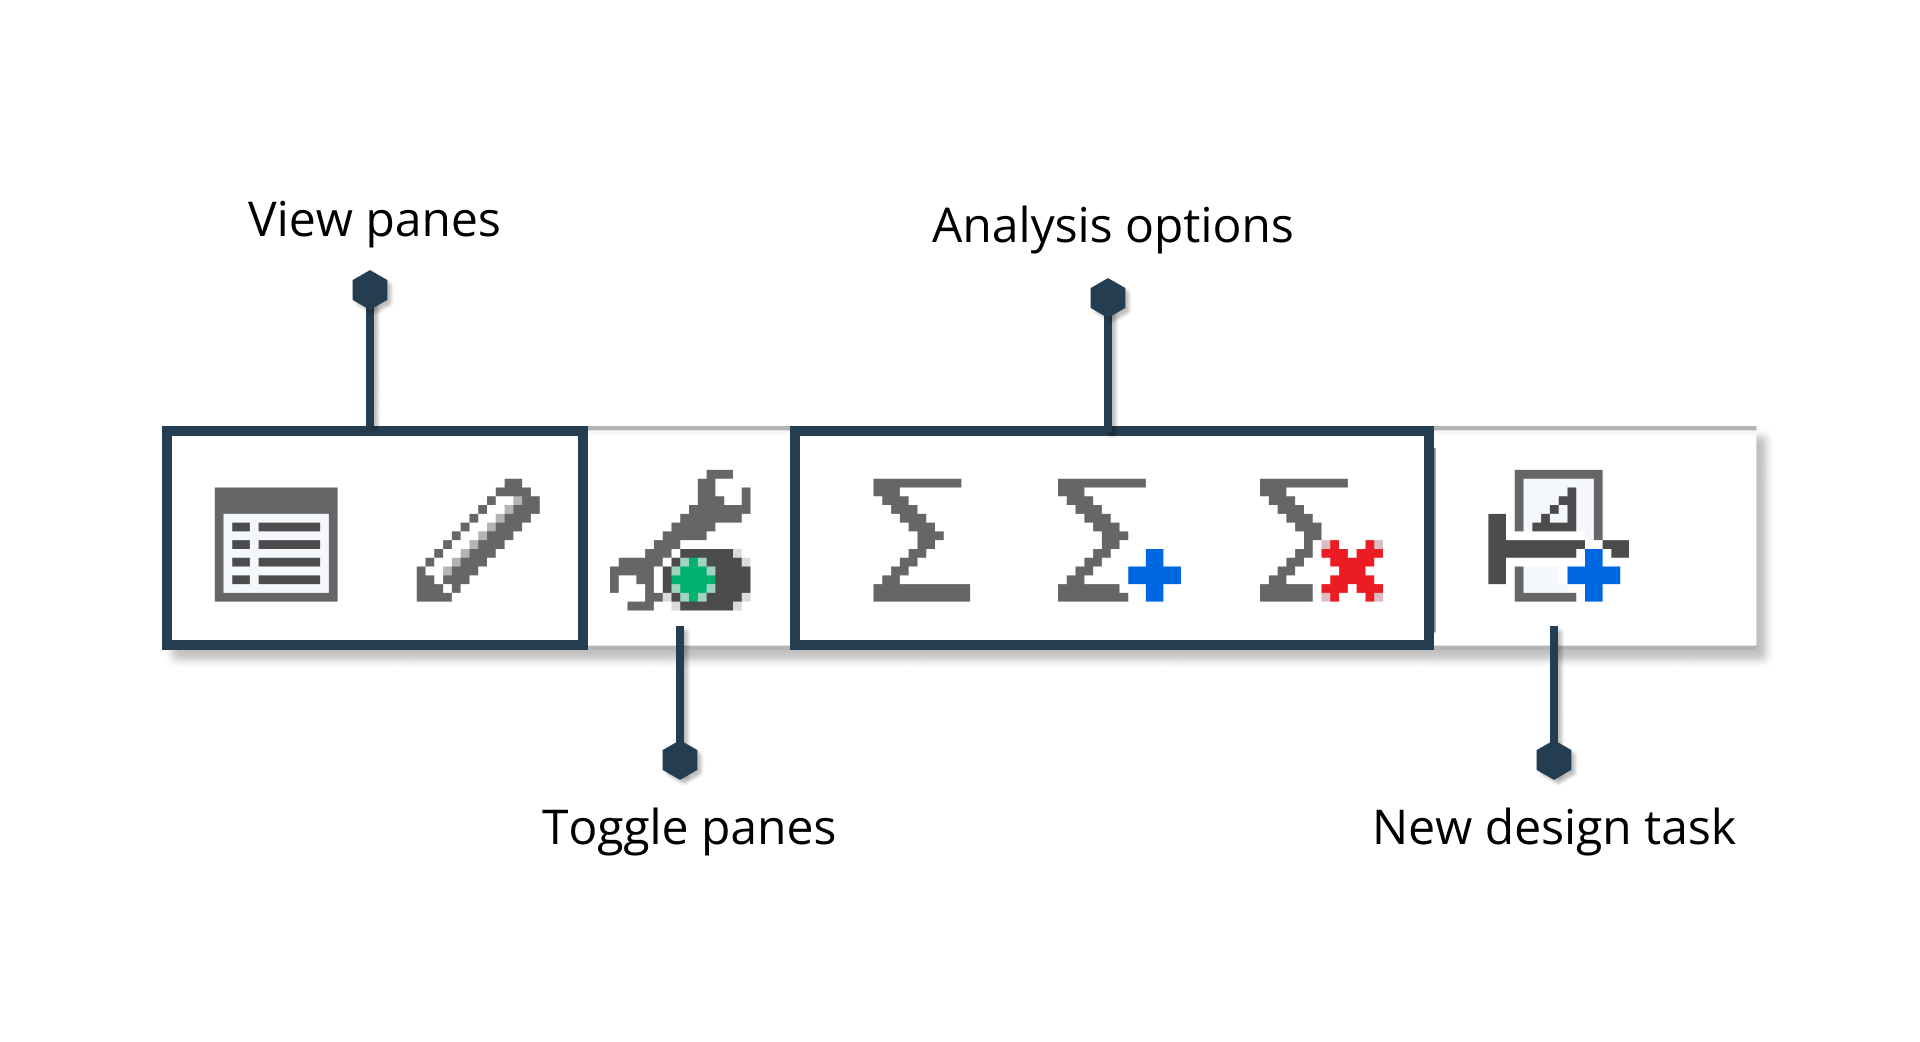
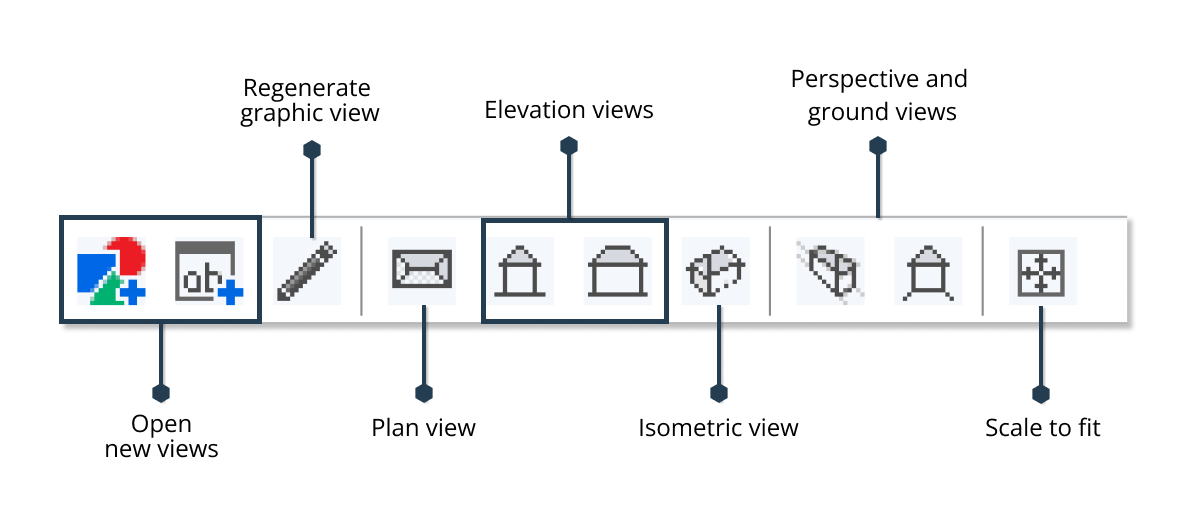
GSA toolbar
Provides access to some of the main GSA tools, including View panes, design and analysis options.
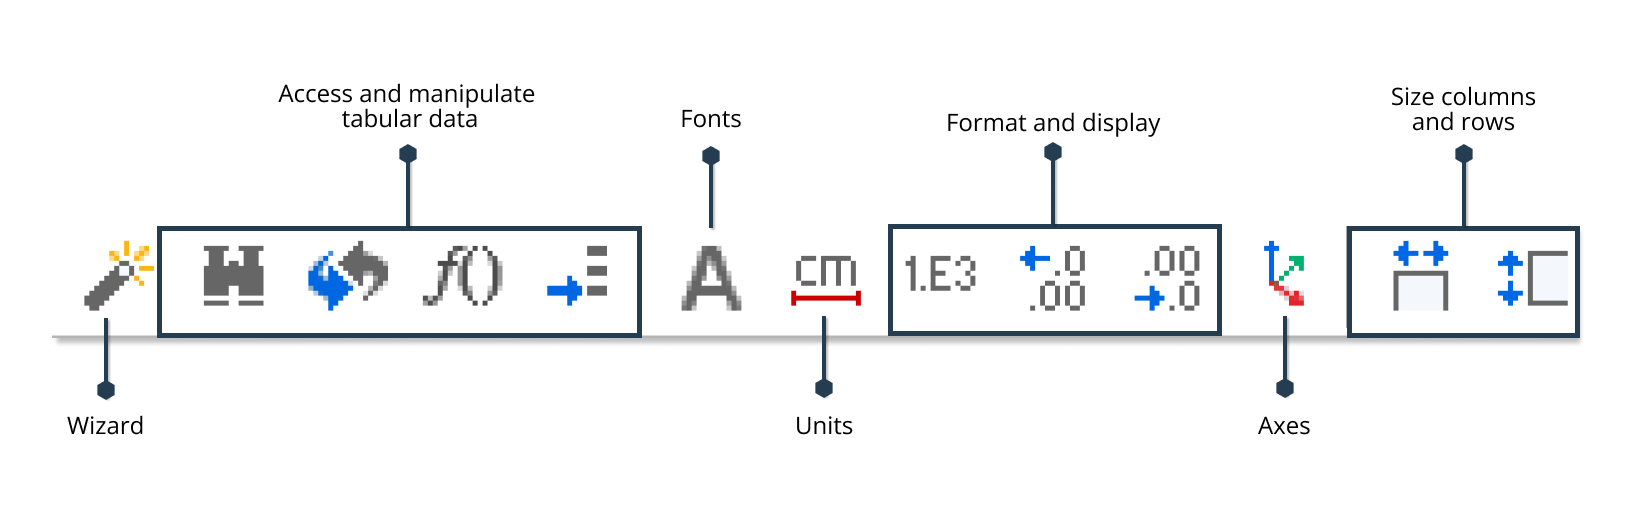
Data options
Modify your model's data, and how it is displayed using the Data options toolbar.
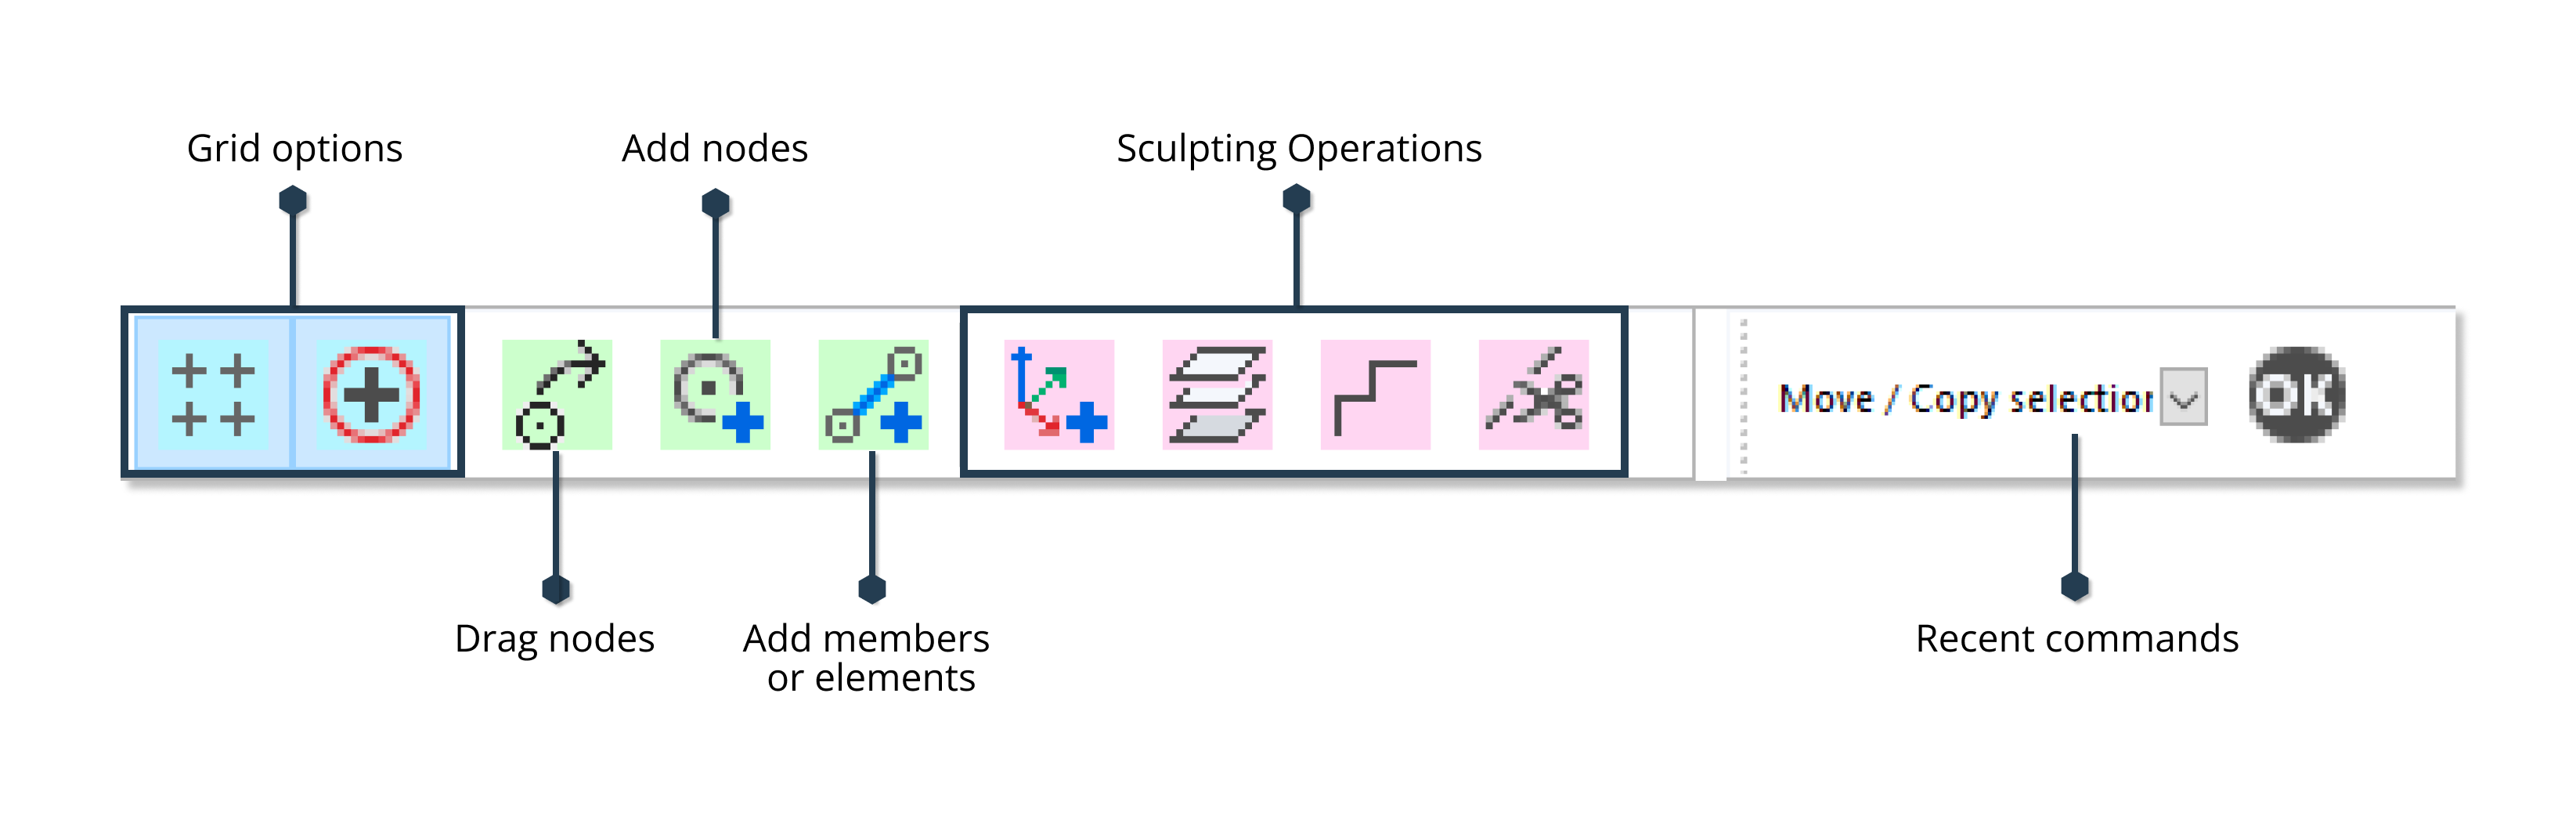
Sculpt
Sculpt tools allow you to edit your model in the graphic view.
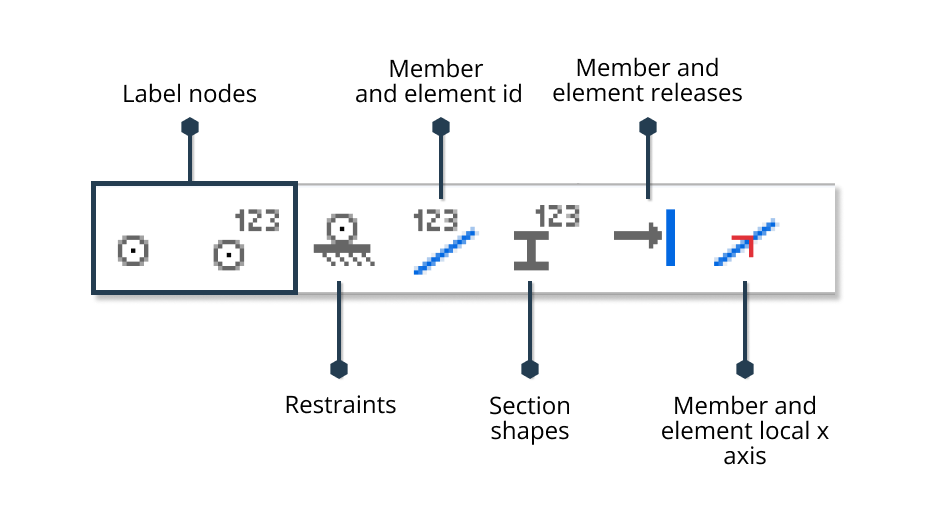
Labels
Display model attributes by applying Labels to you model.
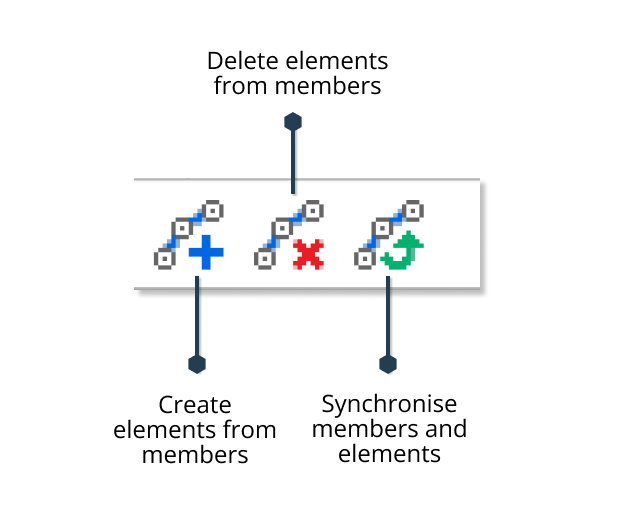
Coordination
Coordinate Design layer members and Analysis layer elements so that they are synchronised.
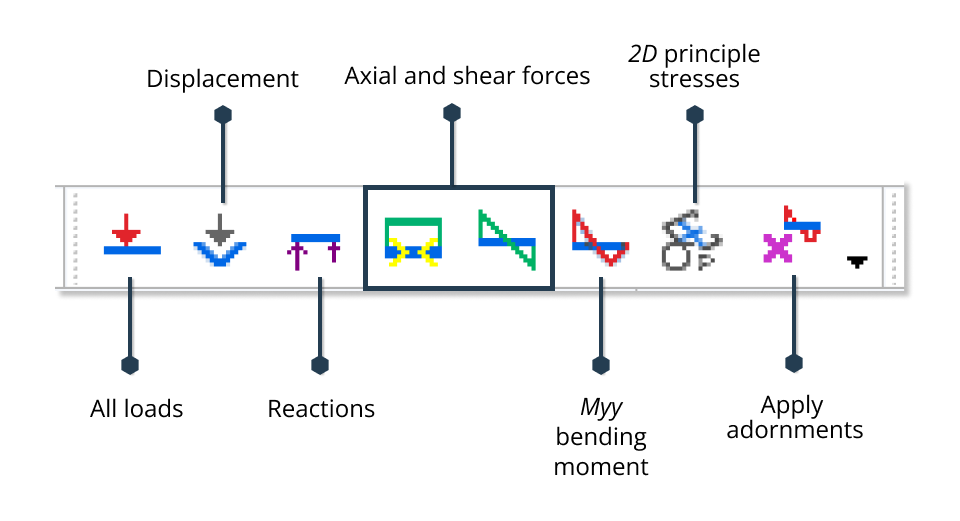
Diagrams
Access frequently-used Diagram displays.
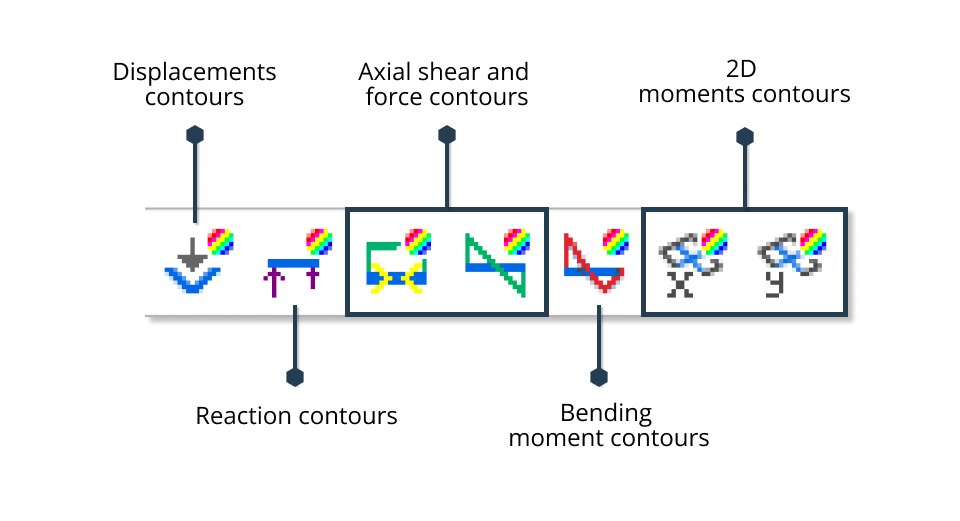
Contours
Apply Contours to nodes and elements from the Contours toolbar.
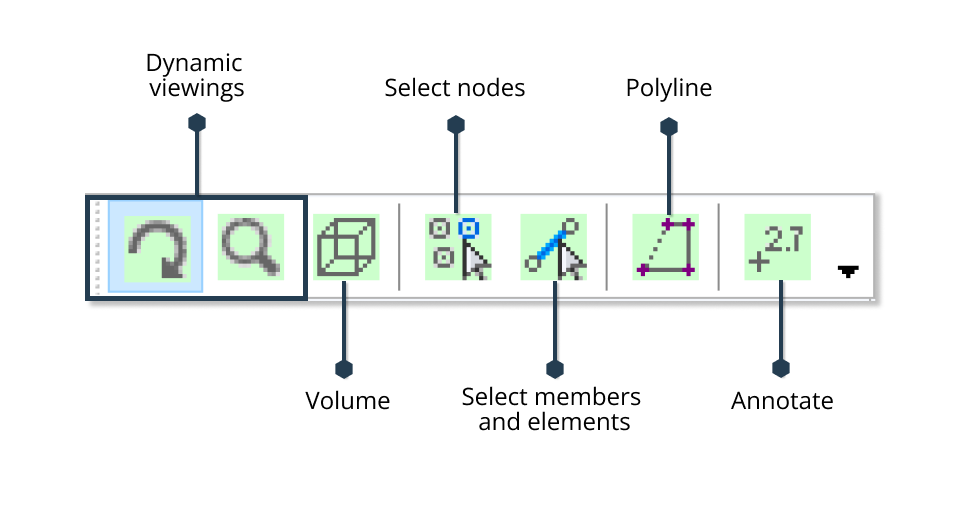
Orientation
Change your graphic view display using the orientation tools.
Cursor mode
Change your cursor mode using the Cursor toolbar.
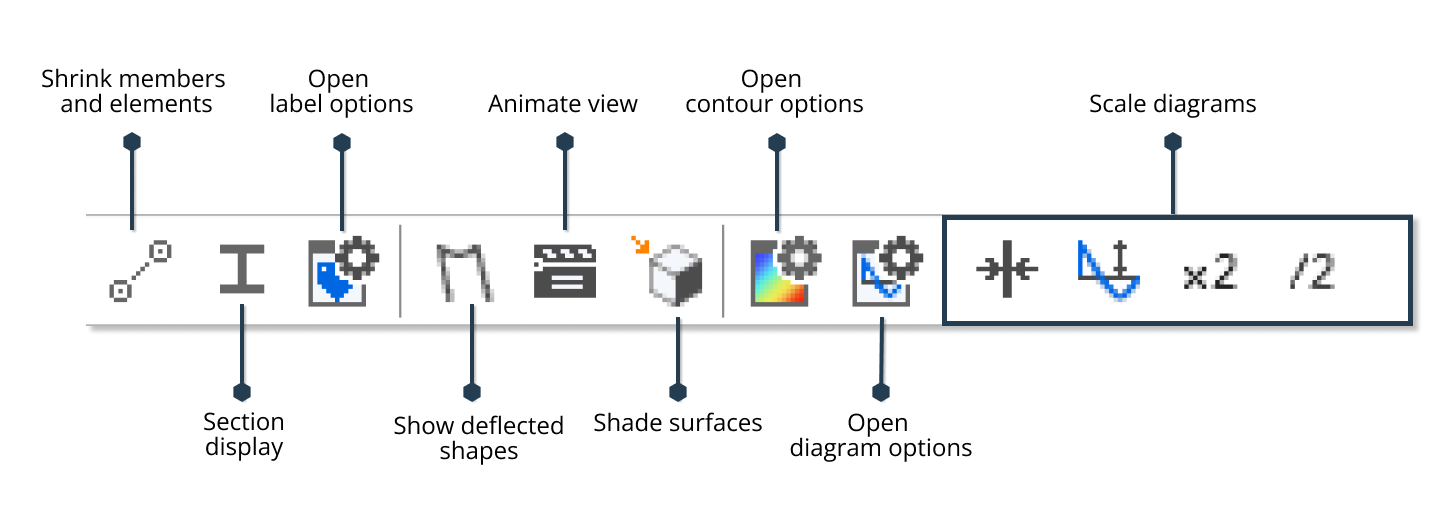
Graphic display
Access tools to modify the appearance of your display with the Graphic display toolbar.
Visit the GSA References entry on toolbars for more on this topic.
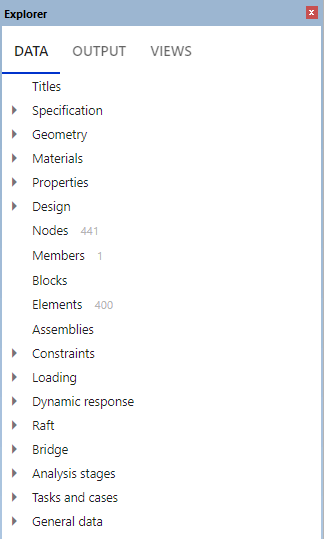
2. Explorer pane
The Explorer pane is where your model's data is contained. It is split into three tabs: Data, Output and View.
Note: Both the Explorer and Properties panes are dockable, they can be maximised, minimised and moved freely around the interface.
Within each tab you can:
- Right click on a field to delete, copy, and paste.
- Use Ctrl + select to open multiple data items.
The Data tab displays a list of input fields available in GSA. Click on a field to open its corresponding Data input table.
The Output tab displays a list of available data output options, depending on the state of the model.
The View tab presents a list of graphic and output views. You can also save preferred settings for views, which are available to access here.
- A graphic view displays a graphic image of the structure (i.e., on the central graphic interface).
- Output view displays tabular output.
Tip: Tabular views may be useful for editing data with very large records (e.g., nodes), or for presenting corresponding modules alongside one another, (e.g., beam sections and beam loads).
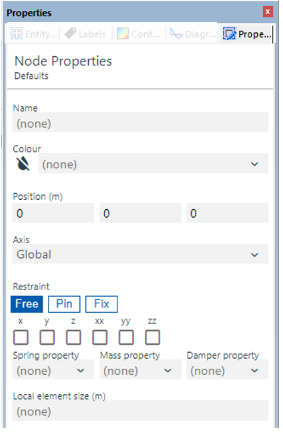
3. Properties Pane
From the Properties pane, you can edit the data inputted into your model.
Note: All tabs in properties pane offer the Lock image update command. This feature is useful for large models which take a considerable time to update the view. Rotating, zooming, or panning the view will unset Lock image update.
Properties
Configured according to the current definition entity. To set this,
- Click on an entity in the graphic view.
- Go to Explorer pane > Views > Graphic views, where it will be highlighted.
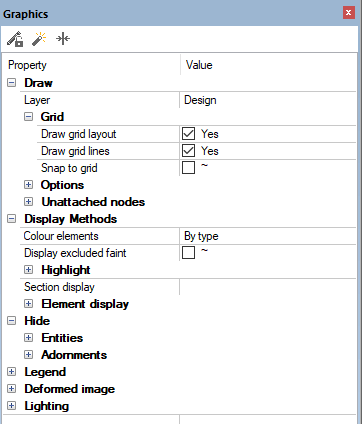
Graphics
Displays a list of frequently used graphic view settings. Icons in the graphics pallet include:
- Wizard – adjust graphic settings here.
- Reset display adornments – re-sets graphic settings to current defaults.
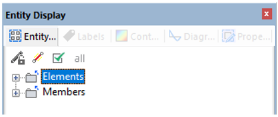
Entity display
Presents the entities displayed in the current graphic view.
- Highlight mode - highlights selected entities in the graphic view.
- Check boxes - view list of entities with check boxes, to allow multiple selection.
- Reset to all entities - resets display list to ‘all’, and clears ‘volumes’.
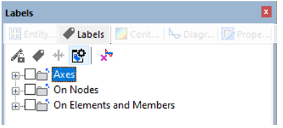
Labels
Adjust label display in the Graphic view.
- Hide labels - toggles on/off, without adjusting labelling settings.
- Reset - default settings.
- Labels and display methods - opens label and display methods dialog box.
- Apply adornments to selection - applies to current selection only.
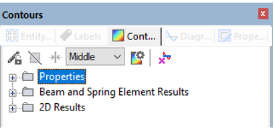
Contours
Set contours in the Graphic view.
- Hide contours - toggles on/off.
- Reset - default settings.
- Layer combo - sets output layer for 2D element stress contours.
- Contour settings - opens contour settings dialog.
- Apply adornments to selection - applies to current selection only.
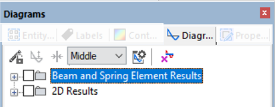
Diagrams
Set diagrams in the graphic view.
- Hide diagrams - toggles on/off.
- Reset - default settings.
- Layer combo - sets output layer.
- Diagram settings - opens contour settings dialog.
- Apply adornments to selection - applies to current selection only.
4. Output pane
The Output pane consists of messages, results and reports.
Messages
- Displays properties for a selected item.
Results
- Displays specific results for a selected node or element.
Reports
- Presents an output log from processes such as a data check or analysis.
5. Graphic interface
The central Graphic interface (or Graphic view) is where your model's structures are displayed. Any number of graphic views may be opened for a document.
Views in the graphic interface
Moving windows
Note: You can also move windows using the keyboard shortcut Ctrl + Nos. 1-9 on the number pad.
View settings
Use the Paintbrush icon  in the top toolbar to copy view settings to another graphic view: